Denmark Curiosa (1 in 90% CI in 0.8-1.25) [Power / Sample Size]
It was mentioned here several times that Danish Medicines Agency has one more requirement for BE:
"In the opinion of the Danish Medicines Agency, the 90 % confidence intervals for the ratio of the test and reference products should include 100 %, regardless that the acceptance limits are within 80.00-125.00 % or a narrower interval. Deviations are usually only accepted if it can be adequately proved that the deviation has no clinically relevant impact on the efficacy and safety of the medicinal product." source (bolded by me)
Btw. FDA document (Guidance for Industry: Bioavailability and Bioequivalence Studies for Orally Administered Drug Products - General Considerations) states in section II. BACKGROUND:
C. Bioequivalence
Bioequivalence is defined in § 320.1 as:
the absence of a significant difference in the rate and extent to which the active ingredient or active moiety in pharmaceutical equivalents or pharmaceutical alternatives becomes available at the site of drug action when administered at the same molar dose under similar conditions in an appropriately designed study.
When value 1 is outside of 90% CI of GMR then there is a significant difference (maybe except for some border cases). - End of fun, of course this statistically significant difference is not relevant for FDA according to other statements requiring the confidence interval in the BE limits.
On the other hand, if some new regulatory reader is suprised with the significant difference between IMPs (acc. to ANOVA p value) and ask for justification. He would be probably shocked by the answer: "It is not possible to plan the BE study with assumention of GMR=0.95, CV=x%, 90% CI in 0.8-1.25 and not significant treatment effect for power at least 80%."
Maybe, Denmark has the requirement as a way to keep "Forced BE" away.
(Sounds good, until the problems appear and it can filter not only "Forced BE" as everyone knows.)
Nevertheless the EMA's statement "The number of subjects to be included in the study should be based on an appropriate sample size calculation." should be sufficient (to keep "Forced BE" away), if controlled correctly.
(Many of regulatory authorities think that sample size is issue of ethical committees. Many of ethical committees are not able to assess the sample size estimation.)
Back to the future:
Should be the requirement of the inclusion of 100% in 90% CI included in the sample size estimation? (I would bet it has never been used.) ... It's quite problematic task.
(So this post is only for interest to know. - I can not imagine the actual use after I made some power analysis.)
One issue is that with increasing sample size we will get 100% out of 90% CI (Helmut the Hero showed it graphically here).
Another issue is that test and reference products can differ (eg. the assayed content can differ up to 5%, even if the difference is zero (according to CoAs), there is some analytical accuracy, etc.), so it is usual to use null ratio 0.95 for sample size estimation (and possible worse ratio to 0.9 as option - discussed here).
(Null ratio 0.90 would be unlucky coin flipping for Denmark.)
I performed some simulations for power (with added condition of 1 in 90% CI to the condition of 90% CI in 0.8-1.25 (in counting step)).
So I can share my figures (more accurately levelplots) for different null ratio (expected GMR used for power estimation via simulations):
GMR = 0.95 GMR = 0.96![[image]](img/uploaded/image416.png)
![[image]](img/uploaded/image417.png)
![[image]](img/uploaded/image430.png)
For GMR = 0.95 (left side) the maximum simulated power is 0.7809. (For n 12-80 and CV 1-50 maximum simulated power for GMR=0.95 is 0.7888.)
Nice to know that with all these requirements+assumptions the power is below 80%. (Or at least seems to be acc. to simulations.)
GMR = 0.97 GMR = 0.98![[image]](img/uploaded/image418.png)
![[image]](img/uploaded/image419.png)
GMR = 0.99 GMR = 1![[image]](img/uploaded/image420.png)
![[image]](img/uploaded/image421.png)
For GMR = 1 (right side) the maximum simulated power is 0.9016.
Green columns are little defect due to I decided to move set.seed function into loops (so same seed was used for each combination of n and intra-subject CV, which looks better for smooth color transitions. And I decided to use only 20 colors for easy to see which value is over 80% and which over 90%. So I prepare two additional figures.)
The darker green columns are saying that values are in 0.9-0.95, but the values are close to 0.9, and similar issue in the lighter green category 0.85-0.9 - almost in whole green region all values are really close to 0.9.)
And columns appeared because n+2 makes little bit more change than CV+1 (with the same seed used).
GMR = 1 (additional 1) GMR = 1 (additional 2)![[image]](img/uploaded/image422.png)
![[image]](img/uploaded/image423.png)
GMR = 1 - additional 1 (left side): Function set.seed is still in loops so there is trend in coloring. (Green color is close to 0.9 in the scale.)
GMR = 1 - additional 2 (right side): Function set.seed moved before loops so values are over 90% randomly - it's the same as using of different seed for each combo of n and CV. (Actually there are many of values around 90% power - simulated values are sometimes little bit over 90% - because it is not exact method of course.)
For GMR = 1 (right side, with set.seed before loops) the maximum simulated power is 0.9073.
Null GMR 1, max power 0.90 with alpha 0.05. The simulations confirm what I never thought about but what everyone can expect.
Really scary when sponsor wants to plan the BE study with power 90%. You must expect the GMR value equal to 1 and anyway power 90% is just a theoretical maximum, in practice the power is always lower than 90%. Moreover I ignore that this should be valid for two PK metrics (AUC and Cmax).
GMR = 0.9
![[image]](img/uploaded/image424.png)
For GMR = 0.9 the maximum simulated power is 0.4757.
Little bit going to extreme n and CV (presented twice - 1) on the left to easy see categories; 2) on the right as presentable;)
GMR = 0.95 (20 colors) GMR = 0.95 (200 colors)![[image]](img/uploaded/image425.png)
![[image]](img/uploaded/image426.png)
For GMR = 0.95 the maximum simulated power is 0.8012 (n=12-480 and CV=1-300%). It can be over 0.8 only due to lucky number as a seed used in simulations, etc..
With comparison to EMA: (I used the same simulations as for Denmark requirement "1 in 90% CI in 0.8-1.25", although exact method exist for standard "90% CI in 0.8-1.25").
GMR = 1:
![[image]](img/uploaded/image427.png)
Green area: For Denmark almost 90% power, standardly almost 100% power. It's a big difference!
GMR = 0.95:
![[image]](img/uploaded/image428.png)
No green area for Denmark at all!
GMR = 0.9:
![[image]](img/uploaded/image429.png)
No comment!
Coded (with the use of function provided by Hero d_labes here) as:
power.sim2x2 <- function(CV, GMR, n, nsims=1E4, alpha=0.05, lBEL=0.8, uBEL=1.25, details=FALSE)

{

  ptm <- proc.time()

  # n is total if given as simple number

  # to be correct n must then be even!

  if (length(n)==1) {

    nsum <- n

    fact <- 2/n

  }

  if (length(n)==2) {

    nsum <- sum(n)

    fact <- 0.5*sum(1/n)

  }

  mse    <- log(1.0 + CV^2)

  df     <- nsum-2

  tval   <- qt(1-alpha,df)

  # Attention! With nsims=1E8 memory of my machine (4 GB) is too low

  # Thus work in chunks of 1E6 if nsims>1E6.

  chunks <- 1

  ns     <- nsims

  if (nsims>1e6) {

    chunks <- trunc(nsims/1E6)

    ns     <- 1E6

    if (chunks*1e6!=nsims){

      nsims <- chunks*1e6

      warning("nsims truncated to", nsims)

    }

  }

  BEcount <- 0

  sdm     <- sqrt(fact*mse)

  mlog    <- log(GMR)

  for (i in 1:chunks)

  {

    # simulate sample mean via its normal distribution

    means  <- rnorm(ns, mean=mlog, sd=sdm)

    # simulate sample mse via chi-square distribution of df*mses/mse

    mses   <- mse*rchisq(ns,df)/df

    hw     <- tval*sqrt(fact*mses)

    lCL <- means - hw

    uCL <- means + hw

    # point  <- exp(means)

    lCL    <- exp(lCL)

    uCL    <- exp(uCL)

    #BE     <- (lBEL<=lCL & uCL<=uBEL) # standard check if 90% CI of GMR is in 0.8-1.25 (without rounding CI limits)

    BE <- lBEL<=lCL & uCL<=uBEL & lCL<=1 & 1<=uCL # change for Denmark

    BEcount <- BEcount + sum(BE)

  }

  if (details) {

    cat(nsims,"sims. Time elapsed (sec):\n")

    print(proc.time()-ptm)

  }

  BEcount/nsims

}


n=seq(12,48,2)

CV=seq(1,30,1)

power_sim=matrix(0,nrow=length(CV),ncol=length(n))

for (i in 1:length(CV)){

 for (j in 1:length(n)){

  set.seed(12345) # if set.seed is done before the "for loop", it generate differ set for each n and CV combination

  power_sim[i,j]=power.sim2x2(CV=CV[ i ]/100,GMR=0.95,n=n[j],nsims=1E4, alpha=0.05, lBEL=0.8, uBEL=1.25) # I have it without rounding 90% confinfidence limits and with added condition of 1 in 90% CI

 }

}

max(power_sim)


 # I know, someone can do it better (eg. in 3D like this kind of figure).

 # But not me. x)

library(lattice)

x <- n

y <- CV

z <- t(power_sim)

rownames(z) <- x

colnames(z) <- paste(as.character(y),"%")

ck=list(at=seq(0,1,0.05),labels=c("0 %","5 %","10 %","15 %","20 %","25 %","30 %","35 %","40 %","45 %","50 %","55 %","60 %","65 %","70 %","75 %","80 %","85 %","90 %","95 %","100 %"))

levelplot(z, at=seq(0,1,length=21), colorkey=ck, col.regions=colorRampPalette(c("black","brown","red","orange","yellow","green")), xlab="n", ylab="CV (%)", main=list(c("                                                 1 in 90% CI in 0.8000-1.2500","                                       Power"),cex=c(1.2,0.8)))

 # or below is better looking

#levelplot(z, col.regions=colorRampPalette(c("black","brown","red","orange","yellow","green")), at=seq(0,1,length=201), xlab="n", ylab="CV (%)", main=list(c("                                                 1 in 90% CI in 0.8000-1.2500","                                       Power"),cex=c(1.2,0.8)))


 # -----

 # for levelplot of extreme n and CV: n=seq(12,480,2); CV=seq(1,300,1);

#x_ticks=c(1,20,45,70,95,120,145,170,195,220,235)

#y_ticks=c(1,10,20,30,40,50,75,100,150,200,250,300)

#levelplot(z, at=seq(0,1,length=21), colorkey=ck, col.regions=colorRampPalette(c("black","brown","red","orange","yellow","green")), scales=list(x=list(at=x_ticks,labels=n[x_ticks]),y=list(at=y_ticks,labels=sprintf("%s %%",y_ticks))), xlab="n", ylab="CV (%)", main=list(c("                                                 1 in 90% CI in 0.8000-1.2500","                                               Power"),cex=c(1.2,0.8)))

 # or below is better looking

#levelplot(z, col.regions=colorRampPalette(c("black","brown","red","orange","yellow","green")), at=seq(0,1,length=201), scales=list(x=list(at=x_ticks,labels=n[x_ticks]),y=list(at=y_ticks,labels=sprintf("%s %%",y_ticks))), xlab="n", ylab="CV (%)", main=list(c("                                                 1 in 90% CI in 0.8000-1.2500","                                               Power"),cex=c(1.2,0.8)))
In this case, it's more than true to say:
Power. That which statisticians are always calculating
but never have. Stephen Senn internal source
Wingardium Leviosa,
zizou
Complete thread:
- Denmark Curiosa (1 in 90% CI in 0.8-1.25)zizou 2017-02-05 02:03 [Power / Sample Size]
![[Mix]](https://static.bebac.at/img/mix.png "open in Mix view")
- Kudos! Helmut 2017-02-05 19:16
- Kudos! ElMaestro 2017-02-05 21:15
- Joking! Helmut 2017-02-06 13:27
- Thanks, and DKMA ElMaestro 2017-02-06 13:46
- Power with a Danish twist Helmut 2017-02-07 15:23
- Danish ultra-conservatism d_labes 2017-02-08 10:57
- Danish ultra-conservatism Helmut 2017-02-08 11:47
- Danish ultra-conservatism d_labes 2017-02-08 10:57
- Power with a Danish twist Helmut 2017-02-07 15:23
- Thanks, and DKMA ElMaestro 2017-02-06 13:46
- Kudos to ElMaestro! d_labes 2017-02-06 15:06
- Plausible Helmut 2017-02-06 17:16
- Plausible to me too d_labes 2017-02-06 20:25
- Plausible to me too ElMaestro 2017-02-06 22:30
- Plausible to me too zizou 2017-02-06 22:42
- THX d_labes 2017-02-07 10:01
- Plausible to me too d_labes 2017-02-06 20:25
- Plausible Helmut 2017-02-06 17:16
- Joking! Helmut 2017-02-06 13:27
- Kudos! ElMaestro 2017-02-05 21:15
- 3D Helmut 2017-02-06 13:47
- Denmark Curiosa (1 in 90% CI in 0.8-1.25) d_labes 2017-02-06 14:54
- Denmark Curiosa (1 in 90% CI in 0.8-1.25) zizou 2017-02-08 21:03
- Alternative CI for BE decision d_labes 2017-02-09 11:18
- Alternative CI for BE decision ElMaestro 2017-02-09 11:36
- Alternative CI for BE decision d_labes 2017-02-09 11:48
- How decidedly odd ElMaestro 2017-02-09 13:28
- How decidedly odd zizou 2017-02-09 14:42
- How decidedly odd ElMaestro 2017-02-09 13:28
- Alternative CI for BE decision Helmut 2017-02-09 13:41
- No alternative d_labes 2017-02-09 20:37
- No alternative ElMaestro 2017-02-10 13:51
- No alternative? mittyri 2017-02-10 15:28
- Dinamarka? d_labes 2017-02-10 20:10
- OT: Czech beer d_labes 2017-02-10 19:57
- No alternative? mittyri 2017-02-10 15:28
- No alternative ElMaestro 2017-02-10 13:51
- No alternative d_labes 2017-02-09 20:37
- Alternative CI for BE decision d_labes 2017-02-09 11:48
- Alternative CI for BE decision ElMaestro 2017-02-09 11:36
- Alternative CI for BE decision d_labes 2017-02-09 11:18
- Denmark Curiosa (1 in 90% CI in 0.8-1.25) zizou 2017-02-08 21:03
- Denmark Curiosa (1 in 90% CI in 0.8-1.25): Gone Helmut 2019-11-08 12:47
- Kudos! Helmut 2017-02-05 19:16

 Ing. Helmut Schütz
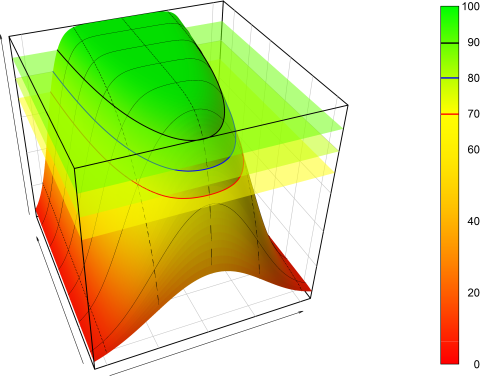