3D [Power / Sample Size]
posted by Helmut ![]() – Vienna, Austria, 2017-02-06 14:47 (2633 d 14:11 ago) – Posting: # 17021
– Vienna, Austria, 2017-02-06 14:47 (2633 d 14:11 ago) – Posting: # 17021
Views: 25,989
Hi zizou,
Your wish is my command. 3D-plots for GMR 0.95. Not sure whether they are more informative than yours.
I know only a few sample sizes by heart. One is for GMR 0.95, CV 30%, and target power 80%: 40 (expected power 81.6%). For Denmark with n=40 we get a mere 76.5%. Note the red contour lines at 70% power. As you discovered as well we never reach 80%. Fascinating the behavior at low CVs. If we increase the sample size, power decreases because a significant difference gets more likely. What a mess.
❝ I know, someone can do it better (eg. in 3D like this kind of figure).
Your wish is my command. 3D-plots for GMR 0.95. Not sure whether they are more informative than yours.
Conventional BE (rest of the world)
![[image]](img/uploaded/image431.png)
Denmark: 100% included in 90% CI
![[image]](img/uploaded/image432.png)
I know only a few sample sizes by heart. One is for GMR 0.95, CV 30%, and target power 80%: 40 (expected power 81.6%). For Denmark with n=40 we get a mere 76.5%. Note the red contour lines at 70% power. As you discovered as well we never reach 80%. Fascinating the behavior at low CVs. If we increase the sample size, power decreases because a significant difference gets more likely. What a mess.
—
Dif-tor heh smusma 🖖🏼 Довге життя Україна!![[image]](https://static.bebac.at/pics/Blue_and_yellow_ribbon_UA.png)
Helmut Schütz
![[image]](https://static.bebac.at/img/CC by.png)
The quality of responses received is directly proportional to the quality of the question asked. 🚮
Science Quotes
Dif-tor heh smusma 🖖🏼 Довге життя Україна!
Helmut Schütz
The quality of responses received is directly proportional to the quality of the question asked. 🚮
Science Quotes
Complete thread:
- Denmark Curiosa (1 in 90% CI in 0.8-1.25) zizou 2017-02-05 02:03
![[Mix]](https://static.bebac.at/img/mix.png "open in Mix view")
- Kudos! Helmut 2017-02-05 19:16
- Kudos! ElMaestro 2017-02-05 21:15
- Joking! Helmut 2017-02-06 13:27
- Thanks, and DKMA ElMaestro 2017-02-06 13:46
- Power with a Danish twist Helmut 2017-02-07 15:23
- Danish ultra-conservatism d_labes 2017-02-08 10:57
- Danish ultra-conservatism Helmut 2017-02-08 11:47
- Danish ultra-conservatism d_labes 2017-02-08 10:57
- Power with a Danish twist Helmut 2017-02-07 15:23
- Thanks, and DKMA ElMaestro 2017-02-06 13:46
- Kudos to ElMaestro! d_labes 2017-02-06 15:06
- Plausible Helmut 2017-02-06 17:16
- Plausible to me too d_labes 2017-02-06 20:25
- Plausible to me too ElMaestro 2017-02-06 22:30
- Plausible to me too zizou 2017-02-06 22:42
- THX d_labes 2017-02-07 10:01
- Plausible to me too d_labes 2017-02-06 20:25
- Plausible Helmut 2017-02-06 17:16
- Joking! Helmut 2017-02-06 13:27
- Kudos! ElMaestro 2017-02-05 21:15
- 3DHelmut 2017-02-06 13:47
- Denmark Curiosa (1 in 90% CI in 0.8-1.25) d_labes 2017-02-06 14:54
- Denmark Curiosa (1 in 90% CI in 0.8-1.25) zizou 2017-02-08 21:03
- Alternative CI for BE decision d_labes 2017-02-09 11:18
- Alternative CI for BE decision ElMaestro 2017-02-09 11:36
- Alternative CI for BE decision d_labes 2017-02-09 11:48
- How decidedly odd ElMaestro 2017-02-09 13:28
- How decidedly odd zizou 2017-02-09 14:42
- How decidedly odd ElMaestro 2017-02-09 13:28
- Alternative CI for BE decision Helmut 2017-02-09 13:41
- No alternative d_labes 2017-02-09 20:37
- No alternative ElMaestro 2017-02-10 13:51
- No alternative? mittyri 2017-02-10 15:28
- Dinamarka? d_labes 2017-02-10 20:10
- OT: Czech beer d_labes 2017-02-10 19:57
- No alternative? mittyri 2017-02-10 15:28
- No alternative ElMaestro 2017-02-10 13:51
- No alternative d_labes 2017-02-09 20:37
- Alternative CI for BE decision d_labes 2017-02-09 11:48
- Alternative CI for BE decision ElMaestro 2017-02-09 11:36
- Alternative CI for BE decision d_labes 2017-02-09 11:18
- Denmark Curiosa (1 in 90% CI in 0.8-1.25) zizou 2017-02-08 21:03
- Denmark Curiosa (1 in 90% CI in 0.8-1.25): Gone Helmut 2019-11-08 12:47
- Kudos! Helmut 2017-02-05 19:16

 Ing. Helmut Schütz
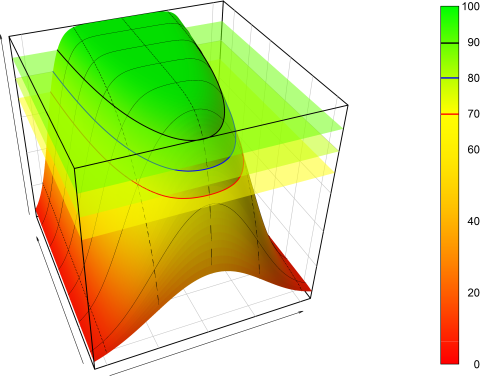